Skip to main content.
Currently:94.8°F Sunny, Dry
Sunny, Dry
Comfort Index: ---
 Updated18-May-2024 5:50pm @ 
 
Time of Next Full Update: 5:55 pm -  Station Elev: 1469 ft  
Pepper Ridge North Valley - Lightning Navigation Menu
Pepper Ridge North Valley - Main Naviagation Menu

Weather Links:

       Home Page 

      Current Weather 

           Forecast Page 

          Historical Data

           Live Lightning 

            Monsoon Info 

        Satellite/Radar 

       Station Info

     Tropical Weather

        Weather Ed. 101 

          Weather Links 

      Weather Photos 

  Weather Warnings

       More Wthr Links 

Us Flag

New FeatureNew Feature
N.O.A.A Radio

Celebrating
15+ Years on the web
2005 - 2020

& 20+ Years of Data
1997 - 2021
At Pepper Ridge

 Weather Reports: 
Monsoon 2022New Feature
 Highlights. 

Monsoon 2021New Feature
 Wrap Up Review. 

Monsoon 2020
 Wrap Up Review. 

Monsoon 2015
 Review. 

Side Bar Php

Current Conditions

@ 18-May-2024 5:50pm
94.8°F Colder 0.9°F than last hour.
Temp Change: °F /hr
Sunny, Dry  Sunny, Dry
Feels Like: 91 °F
Humidity: 16
Dew Point: 41.6 °FDecreased 0.6°F since last hour.
Wind: Wind from W W@
0.7 mph
Gust: 0.0 mph
Pressure: 29.72 in Falling 0.008 inHg/hour
Steady
Solar Rad: 100%
295 W/m2
UV Index: 0.0
None
Rain Today: 0.00 in
Rain Rate: 0.000 in
Rain Month: 0.01 in
Rain Year: 6.13 in

Almanac

Sunrise: 5:24 am
Sunset: 7:23 pm
Moonrise: 3:10 pm
Moonset: 2:47 am
Waxing Gibbous Moon
Waxing Gibbous Moon, Moon age: 10 days,6 hours,52 minutes,79%
79%
Illuminated

Daily Min/Max

Today's High Temp: 97.5°F
2:17pm
Today's Low Temp: 69.0°F
5:16am
Today's High Humidity: 42%
5:02am
Today's Low Humidity: 15%
3:37pm
Today's High Dewpoint: 50.1°F
12:23pm
Today's Low Dewpoint: 39.9°F
5:47pm
Today's High Barometric Pressure: 29.850 in/Hg
10:03am
Today's Low Barometric Pressure: 29.717 in/Hg
5:46pm
Today's High Wind Speed: 12.0 mph
4:51pm
Today's
High UV:
5.0
 Medium 
12:07pm
Today's
High Solar:
1037 W/m2
10:57am
Today's High Rain Rate: 0.000 in/min
5:00pm
Today's High
Hourly Rain Rate:
0.000 in/hr
Days Since
Last Rain:
2 Days

Current NWS Alerts:


Cochise County
  Details for Cochise County Fire Weather Watch
Santa Cruz County
  Details for Santa Cruz County Fire Weather Watch
Graham/Greenlee Counties
  Details for Graham/Greenlee Counties Fire Weather Watch
Pima County
  Details for Pima County Fire Weather Watch
Pinal County
  Details for Pinal County Fire Weather Watch
Yavapai County
  Details for Yavapai County Fire Weather Watch

Lower Sidebar Page
Pepper Ridge Weather Station
USA Weather Finder
United States Weather Group
Wunderground

Sky Warn

CWOP 3794 Quality Control Logo
CW 3794

For more information
about this site
contact the
Web Master

Willow Fire Pyro Cumulus Cloud

Return to Top
of Page

lightning stike

PEPPERRIDGE NORTH VALLEY'S
SOUTHWEST LIGHTNING PAGE

lightning stike

spacer
12 Hour Lightning Flash Rate History:
The yellow number is the peak flash rate count and the time it occurred.
lightning 12 hour flash history

This is a graph of the lightning activity over the last 12 hours.  The darker green lines represents -CG flashes,
while the cyan represents +CG. (CG) = Cloud to Ground Lightning flashes. 
Blue is +IC and pink is -IC. (IC) = Inter/Intra Cloud Lightning flashes.

Updated:  18-May-2024 5:50pm  @    
Detector Status:
There is no significant activity going on.
Cloud to Ground Flash* Color Key:
  <60 sec     < 5 min  
  <10 min     <15 min 
  <30 min     <60 min  
* See Table below (Lightning Flash Analysis Key) to identify all strike classifications displayed on this map
Lightning Map
lightning Map
Storm Analytical Key:
Storm Cells:
No Storms Detected
Rates
Flash Rate: 2/min
Stroke Rate: 2/min
Noise Rate: 2/min
Flashes in last 60 min Strokes in last 60 min Current Information
Total Flashes: 29
+CG Flashes: 3
-CG Flashes: 8
+IC Flashes: 8
-IC Flashes: 10
Strong Flashes: 0
   
Total Strokes: 29
+CG Strokes: 3
-CG Strokes: 8
+IC Strokes: 8
-IC Strokes: 10
CID Strokes: 0
Ratio of Strokes per Flash: 1
Current Storms: 0
Close Storms: 0
Num of Red Alerts: 0
Num of Yellow Alerts: 0
Flash Rate Trend: 1000000%
Stroke Rate Trend: 1000000%
Detection Rate Trend: 1000000%
Daily Records
All Flashes: 321
All Strokes: 321
All CID: 0
All Strong Flashes: 0
All Noises: 2639
+ve IC Flashes: 83
-ve IC Flashes: 111
+ve CG Flashes: 59
-ve CG Flashes: 68
   
+ve IC Strokes: 83
-ve IC Strokes: 111
+ve CG Strokes: 59
-ve CG Strokes: 68
   
Daily Record Rates
Peak Flash Rate: 4/min @ 9:42:58 AM
Peak Strong Flash Rate: 0/min @ 12:00:00 AM
Peak Stroke Rate: 4/min @ 9:42:55 AM
Peak CID Rate: 0/min @ 12:00:00 AM
Peak Noise Rate: 13/min @ 9:59:57 AM
All Time Record Rates
Record Flash Count: 344/min @ 5:59:54 PM on Saturday, July 30, 2022
Record Strong Flash Count: 4/min @ 9:21:41 PM on Tuesday, September 12, 2023
Record Stroke Count: 3032/min @ 6:36:56 PM on Saturday, July 30, 2022
Record CID Count: 3/min @ 4:02:44 PM on Friday, August 12, 2022
Record Noise Count: 2242/min @ 6:37:54 PM on Saturday, July 30, 2022
All Time Daily Records
Record Total Flash Count: 75807 on Friday, August 12, 2022
Record Total Strong Flash Count: 96 on Thursday, August 18, 2022
Record Total Stroke Count: 240342 on Saturday, July 30, 2022
Record Total CID Count: 17 on Saturday, July 30, 2022
Record Total Noise Count: 186156 on Saturday, July 30, 2022
Graph:
More Lightning & Storm Information:
Southwestern U.S Lightning Forecast:
Lightning Forecast
Lightning forecast map courtesy of the NWS
Disclaimer: Do NOT ever base important decisions on this data
L2K Display script courtesy of Matangi Weather
Charts by Highcharts
L2k   v1.52


Real time lightning detection is here, just in time to track the monsoon season thunderstorms. The lightning detection system consists of a Boltek™ lightning detector with lightning analysis performed by Lightning 2000™ from Aninoquisi Software.


Page Updates Every 1 to 2 Minutes:
Number in upper left corner of display represents the number of Flashes in the last minute.
The bar above count Number represents the storm threat potential;
Green = Low Risk , Yellow = Medium Risk and Red = High Risk

Lightning Flash Analysis Key

Type of Lightning BoltFlash
Sym
Time
Occured
Flash
Sym
Time
Ocurred
Flash
Sym
Time
Occured
  + (CG)   Postive Cloud to Ground Flashes < 1 Min Last 5 Min Last
10 Min
  - (CG)   Negative Cloud to Ground Flashes < 1 Min Last 5 Min Last
10 Min
  + (CG)   Postive Intercloud/Intracloud Flashes < 1 Min Last 5 Min Last
10 Min
  - (CG)   Negative Intercloud/Intracloud Flashes < 1 Min Last 5 Min Last
10 Min
 - + (CID)   Compact Intercloud Discharge Flashes < 1 Min Last 5 Min Last
10 Min
    Step Leader Lightning Strikes < 1 Min Last 5 Min Last
10 Min

For Lightning flashes 10 minutes or older, the flashes appear in the following colors;

Green (-CG) and Cyan (+CG) denotes cloud-to-ground lightning discharges,
Fuchsia (+ IC) and Purple (- IC) denotes intercloud/intracloud discharges,
(CID) Compact Intercloud discharges will appear Orange
and Step Leader strikes will appear Yellow

At 15 Minutes Flashes appear as squares, At 30 Minutes Flashes appear as (X)'s,
At 60 Minutes Flashes appear as (+)'s.

Note: The Sizes of Flash images decrease with age up to 60 minutes.


Disclaimer Note: We have completed the calibration process of the storm ranging. Most Storms should now be correctly range, although due the limitations of the Boltek single antenna lightning system, some storms may be initially ranged incorrectly. Usually this corrects itself when multiple lightning strikes have occured, this allows a better analysis to be performed by the lightning 2000 software. Remember do not based your outdoor plans or activities solely on the lightning information provided here, this lightning display is for informational purposes only, and not intended to be used, for the protection of life or property. Remember to follow the, Lightning Safety Rules!, especially if thunderstorms are nearby!


Additional Live Lightning Links:

Aninoquisi Lightning Detector Map

Lightning Explorer Free Page

Pepper Ridge North Valley - Southwest Lightning

National & Regional Lightning MapsNew Feature

Microsferics Real-Time Lightning - North America

Microsferics Real-Time Lightning - Regional New Feature

Weather Bus Lightning Gold Canyon, Az

Nexstorm Testing Page


Please Stay Safe this Summer and Observe the following;
Lightning Safety Rules!


Doppler Radar Image of Arizona


Southwestern Weather Network - Radar and Lightning!

   This map displays a view of lightning data and radar - Over the entire Southwestern United States!

   SWN Lightning/Radar

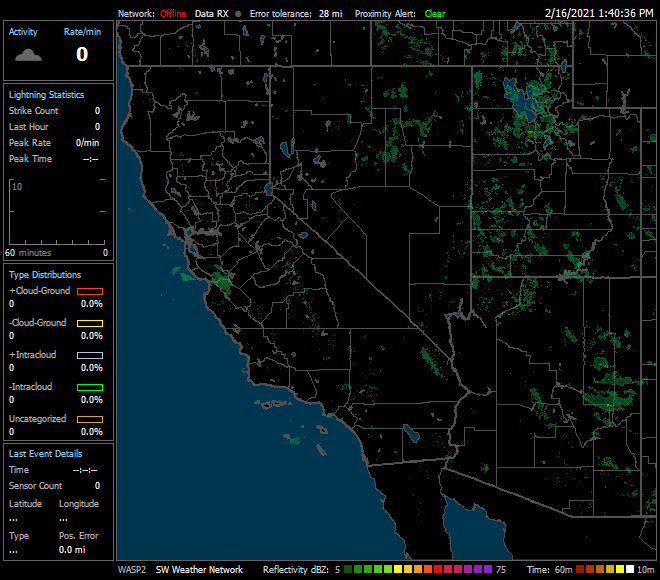
Regional Lightning data/Radar Map Courtesy of Astrogenic and StrikeStar US.
Data supplied by Southwestern Weather Network members and others.


Member of the:
LightningRing

World Weather Websites

 Pepper Ridge North Valley Random Weather Facts

RECORD COLD TEMPS
Hawley Lake recorded Arizona's coldest temperature of 40° below zero on January 7, 1971. The coldest temperature recorded in Phoenix was 16°, set on January 7, 1913. Phoenix Sky Harbor Airport, where the official temperature for Phoenix is recorded, rarely gets below freezing(32°F).

Get the Facts PHP


Page layout last updated on Feb 1st, 2010