Skip to main content.
Currently:90.5°F Sunny, Dry
Sunny, Dry
Comfort Index: ---
 Updated25-Mar-2025 11:55am @ 
 
Time of Next Full Update: 12:00 pm -  Station Elev: 1469 ft  
Pepper Ridge North Valley - SWN Navigation Menu
Pepper Ridge North Valley - Main Naviagation Menu

Weather Links:

       Home Page 

      Current Weather 

           Forecast Page 

          Historical Data

           Live Lightning 

            Monsoon Info 

        Satellite/Radar 

       Station Info

     Tropical Weather

        Weather Ed. 101 

          Weather Links 

      Weather Photos 

  Weather Warnings

       More Wthr Links 

Us Flag

New FeatureNew Feature
N.O.A.A Radio

Celebrating
20 Years on the web
2005 - 2025

& 25+ Years of Data
1997 - 2025
At Pepper Ridge

 Weather Reports: 
Monsoon 2024New Feature
 Highlights. 

Monsoon 2021New Feature
 Wrap Up Review. 

Monsoon 2020
 Wrap Up Review. 

Monsoon 2015
 Review. 

Side Bar Php

Current Conditions

@ 25-Mar-2025 11:55am
90.5°F Warmer 4.4°F than last hour.
Temp Change: °F /hr
Sunny, Dry  Sunny, Dry
Feels Like: 87 °F
Humidity: 18%Decreased 4% since last hour.
Dew Point: 41.2 °FDecreased 1.5°F since last hour.
Wind: Calm
---

 mph
Gust: 0.0 mph
Pressure: 29.88 in Falling 0.031 inHg/hour
Falling
Solar Rad: 100%
896 W/m2
UV Index: 3.9
 Medium 
Rain Today: 0.00 in
Rain Rate: 0.000 in
Rain Month: 1.35 in
Rain Year: 1.36 in

Almanac

Sunrise: 6:24 am
Sunset: 6:43 pm
Moonrise: 4:12 am
Moonset: 2:39 pm
Waning Crescent Moon
Waning Crescent Moon, Moon age: 25 days,3 hours,20 minutes,20%
20%
Illuminated

Daily Min/Max

Today's High Temp: 90.5°F
11:51am
Today's Low Temp: 59.8°F
6:29am
Today's High Humidity: 42%
6:12am
Today's Low Humidity: 17%
11:49am
Today's High Dewpoint: 43.1°F
10:58am
Today's Low Dewpoint: 36.0°F
5:39am
Today's High Barometric Pressure: 29.929 in/Hg
9:36am
Today's Low Barometric Pressure: 29.867 in/Hg
3:53am
Today's High Wind Speed: 6.0 mph
3:16am
Today's
High UV:
3.9
 Medium 
11:54am
Today's
High Solar:
896 W/m2
11:52am
Today's High Rain Rate: 0.000 in/min
5:00pm
Today's High
Hourly Rain Rate:
0.000 in/hr
Days Since
Last Rain:
9 Days

Current NWS Alerts:


No alerts

Lower Sidebar Page
Pepper Ridge Weather Station
USA Weather Finder
United States Weather Group
Wunderground

Sky Warn

CWOP 3794 Quality Control Logo
CW 3794

For more information
about this site
contact the
Web Master

Willow Fire Pyro Cumulus Cloud

Return to Top
of Page

Welcome to Pepperridge North Valley's
Phoenix Air Quality Stats Page


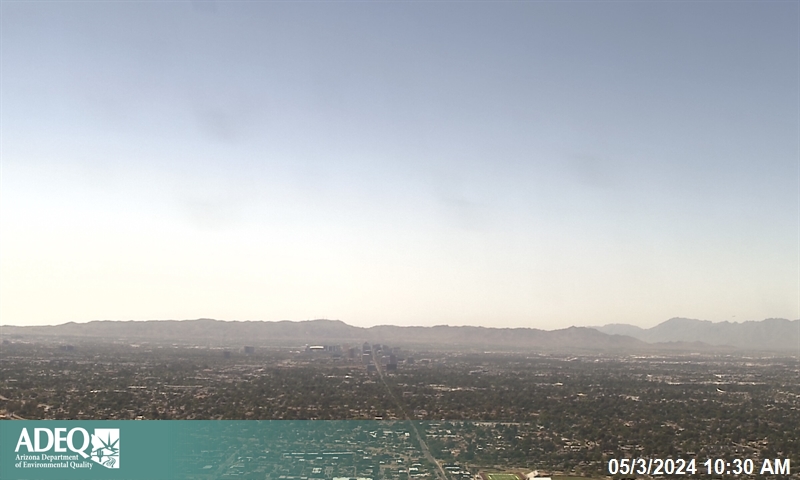
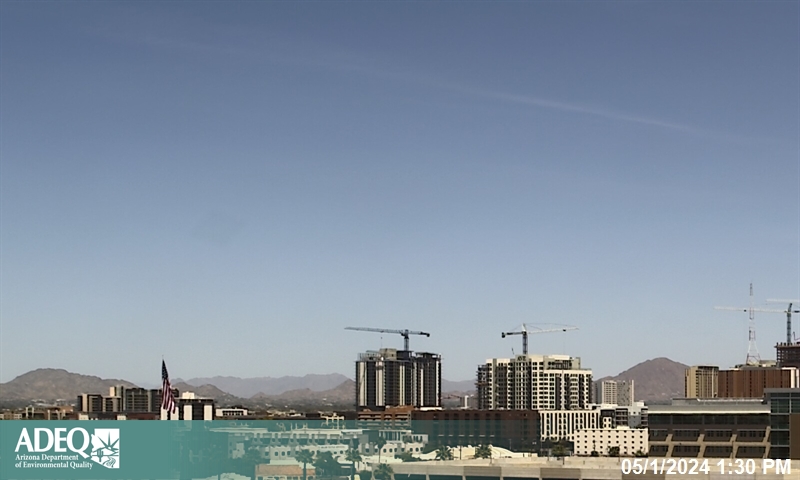
Phoenix, AZ Air Quality Index


Realtime Air Quality Data
Realtime Location: Phoenix, AZ
Issue Date: 03/25/25 11:00 AM MST


Current Air Quality Index

  Moderate 64


Action Day Alert:
There are currently no High Pollution Advisory alerts for Phoenix, AZ

Realtime AQI - Pollutant Details
Type: Particle Pollution (10 microns)
Index: Moderate
AQI Value: 64
  Moderate

Type: Ozone Moderate - 56 AQI - Particle Pollution (2.5 microns)
Index: Good
AQI Value: 40

  Good

Last Update:
Tue, 25 Mar 2025 11:45:02 MST


0-50 Good
51-100 Moderate
101-150 Unhealthy for Sensitive Groups
151-200 Unhealthy
201-300 Very Unhealthy
301-500 Hazardous


Air Quality Forecast
Forecast Location: Phoenix, AZ
Forecast Agency: Arizona Department of Environmental Quality
Two Day Forecast
Day One Forecast Day Two Forecast
Date: 03/25/2025
Type: Ozone
Index: Moderate
AQI Value: 74

  Moderate
Date: 03/26/2025
Type: Particle Pollution (10 microns)
Index: Moderate
AQI Value: 68

  Moderate
Last Update:Tue, 25 Mar 2025 11:45:03 MST


Phoenix Area Haze Cams
South Mountain Cam Camelback Mountain Cam
South Mountain Haze
Camelback Mountain Haze
     Images courtesy of Phoenixvis.net | Map and Full Visibility Images


Current Hourly Air Quality Index Map
AQI: Good AQI: Moderate AQI: Unhealthy for Sensitive Groups AQI: Unhealthy AQI: Very Unhealthy AQI: Hazardous


Today's Air Quality Forecast
AQI: Good AQI: Moderate AQI: Unhealthy for Sensitive Groups AQI: Unhealthy AQI: Very Unhealthy AQI: Hazardous


Today's Air Quality Timed Animation
AQI: Good AQI: Moderate AQI: Unhealthy for Sensitive Groups AQI: Unhealthy AQI: Very Unhealthy AQI: Hazardous


Today's Southwestern U.S. Air Quality Timed Animation
AQI: Good AQI: Moderate AQI: Unhealthy for Sensitive Groups AQI: Unhealthy AQI: Very Unhealthy AQI: Hazardous


Script courtesy of  Michael Holden of Relay Weather. Data courtesy of Airnow.gov


Member of the:
LightningRing

World Weather Websites

 Pepper Ridge North Valley Random Weather Facts

BAROMETRIC PRESSURE
The air that makes up our atmosphere exerts a pressure on the surface of the earth. This pressure is known as atmospheric pressure. It is measured in inches/Hg. Generally, the more air above an area, the higher the atmospheric pressure. Barometric pressure changes with local weather conditions, making barometric pressure an important and useful weather forecasting tool. High pressure zones are generally associated with fair weather, while low pressure zones are generally associated with poor weather. For forecasting purposes, the absolute barometric pressure value is generally less important than the change in barometric pressure. In general, rising pressure indicates improving weather conditions, while falling pressure indicates deteriorating weather conditions.

Get the Facts PHP


Page layout last updated on Jan 3rd, 2011