Updated:
03-Jun-2026 1:10pm @
|
 |
The station is located Lat: 33° 39´ 11´´ N | |||||||||
| Time of Next Full Update: 1:15 pm - Station Elev: 1469 ft | ||
Weather Links: |
|
 New Feature New Feature |
Celebrating
|

|
| |
|
|
|
|
|
|

|
|
For more information |
|
 |
|
Return to Top |
|
Welcome to the Satellite Maps Page |
Latest 2 KM Infrared Satellite Map of Arizona from N.O.A.A. GOES-WESTThis map shows infared spectrum light for the area covering the State of Arizona. This Satellite format is available 24 hours a day. You may need to refresh your browser to see any changes as it updated several times an hour. The time displayed on the map is UTC, NOT Arizona Mountain Standard. 
|
Latest 2 KM Visiable Satellite Map from N.O.A.A. GOES-WESTThis map shows visiable cloud formations in the Arizona State area. Since it is visiable light, it needs to be daylight for anything to show on this image. As a result, this map will appear black during the nighttime hours and will only have visiable information during the daylight hours. You may need to refresh your browser to see any changes The time displayed on the map is UTC, NOT Arizona Mountain Standard. 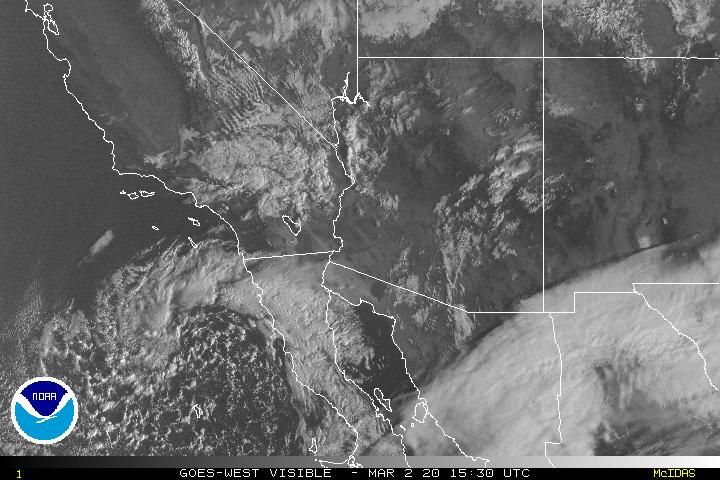
|
The Latest 2 KM Water Vapor Map from N.O.A.A. GOES-WESTThis map shows the amount of available water vapor in the air, for the area covering the State of Arizona. This map is available 24 hours a day You may need to refresh your browser to see any changes as it updated only several times an hour. The time displayed on the map is UTC, NOT Arizona Mountain Standard. 
|
Additional Satellite maps can be found at the following links:N.O.A.A. Satellite ImageryPepper Ridge Weather Links PageUniv of Arizona Satellite Imagery |
Member of the:
|
|
Page layout last updated on July 17th, 2009
Copyright © 2005 - 2026, Pepper Ridge North Valley Weather - All rights reserved .
Unauthorized duplication or distribution is prohibited
Powered By: |
Weather Display vers: 10.37S build: 134 &
WeatherLink 5.71 |
Site Template Designed by: Pali Plumies Designs
Disclaimer:
Never base important decisions on this or any weather information obtained from the Internet.
Number of Visitors Since March 15, 2005